Analytic Results
The first script one should run when using Chroma is bin/analytic/analytic_table.py. This script
computes synthetic photometry magnitudes and chromatic biases for a set of standard template stellar
and galactic SEDs, and stores the results for future use.
$ cd CHROMA_DIR/bin/analytic/
$ python analytic_table.py
With these results stored, we can take our first look at some analytic predictions for chromatic biases by running the following scripts in the bin/analytic/ directory:
$ python plot_DCR_moment_shifts.py
$ python plot_PSF_size_shift.py
These will produce plots in the newly created bin/analytic/output/ directory:
$ ls output/*.png
output/Rbar.LSST_g.png        output/Rbar.LSST_r.png
output/S_m02.LSST_i.png       output/V.LSST_g.png
output/V.LSST_r.png           output/Rbar.LSST_i.png
output/S_p06.Euclid_350.png   output/S_m02.LSST_r.png
output/V.LSST_i.png
The Rbar*png figures show the centroid shifts due to DCR computed for different spectra relative
to the centroid shift of a G5V spectrum. Here’s the plot for the LSST r-band.
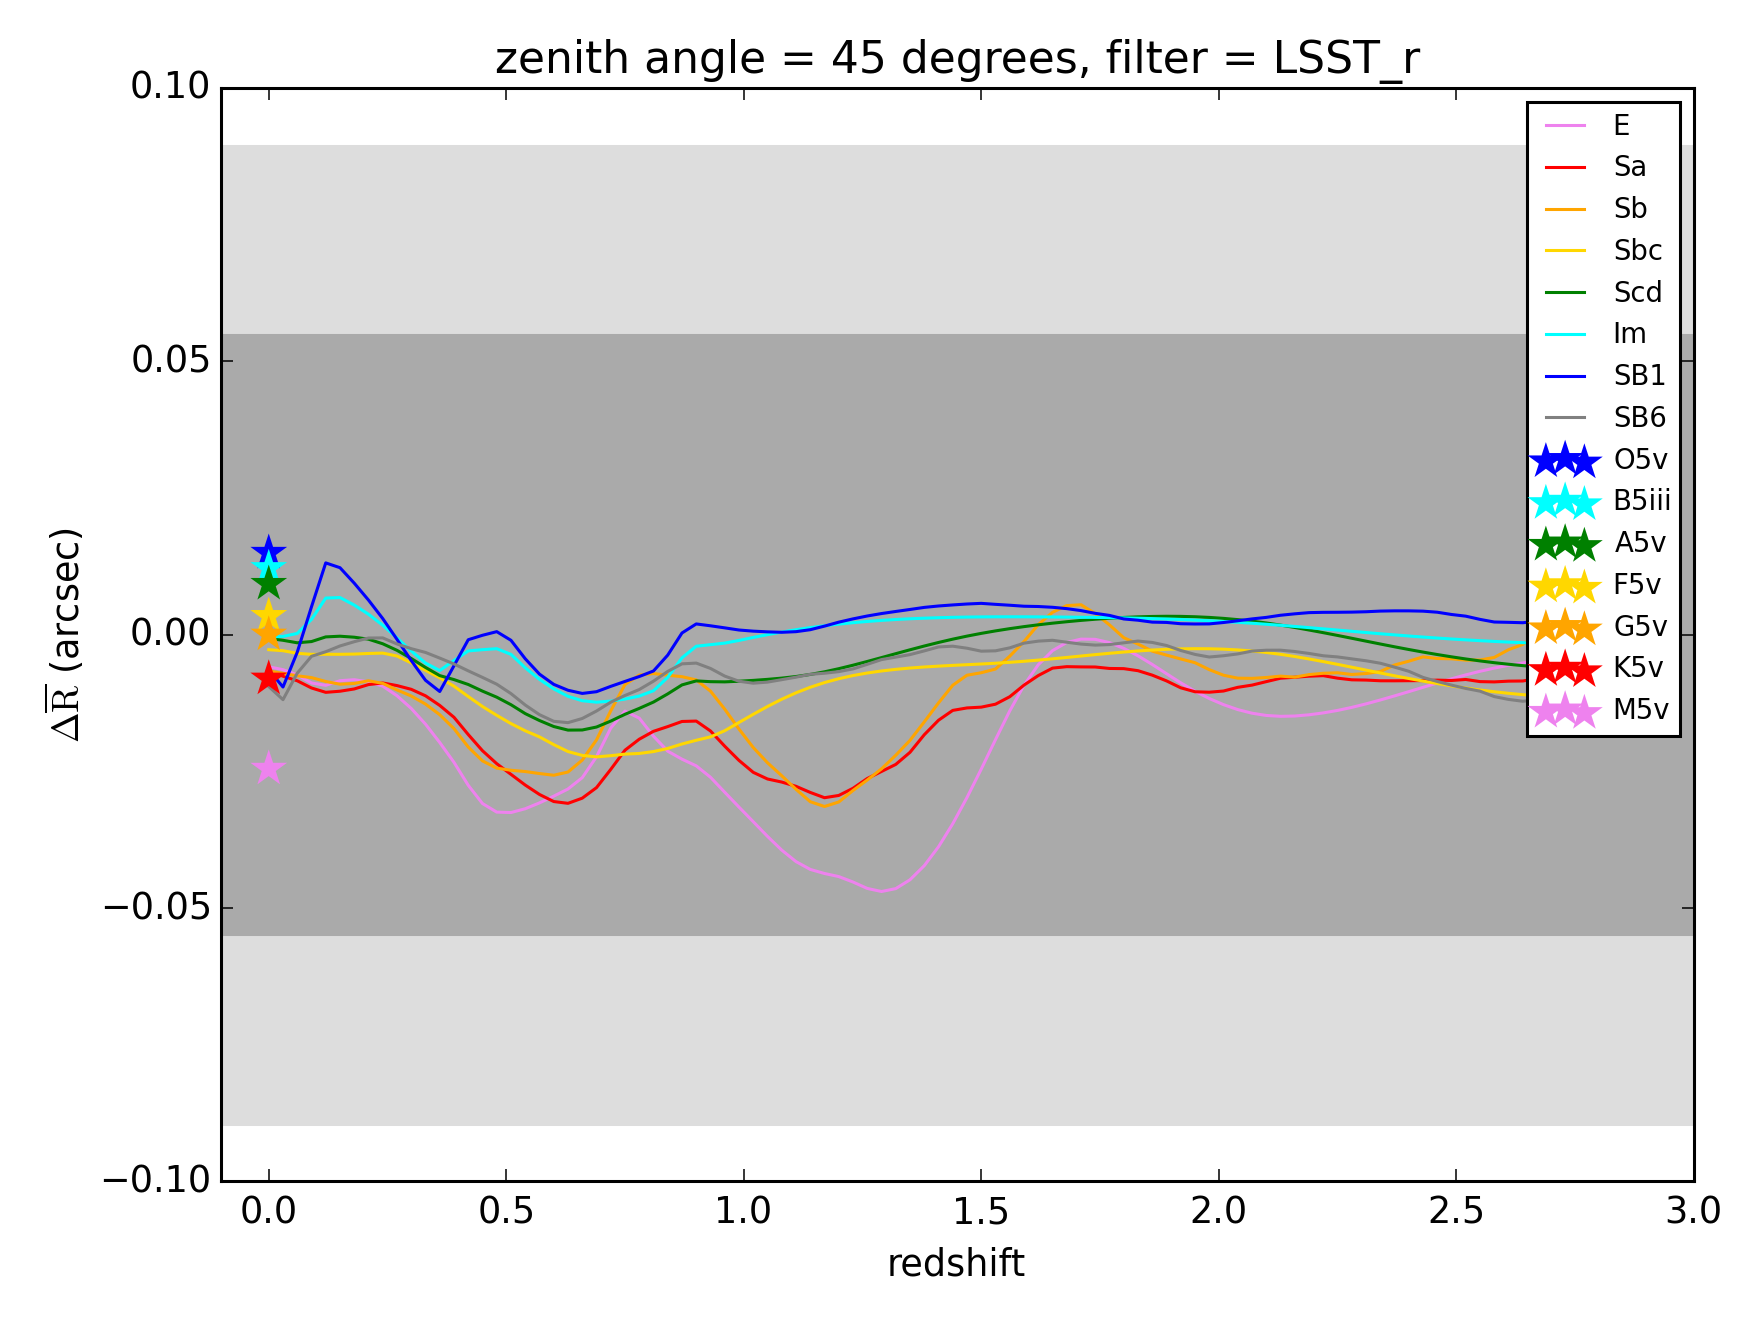
Stellar spectra are represented by star symbols at redshift 0, while galaxy spectra are represented by lines. The wider and narrower gray bands show the requirements for DES and LSST respectively.
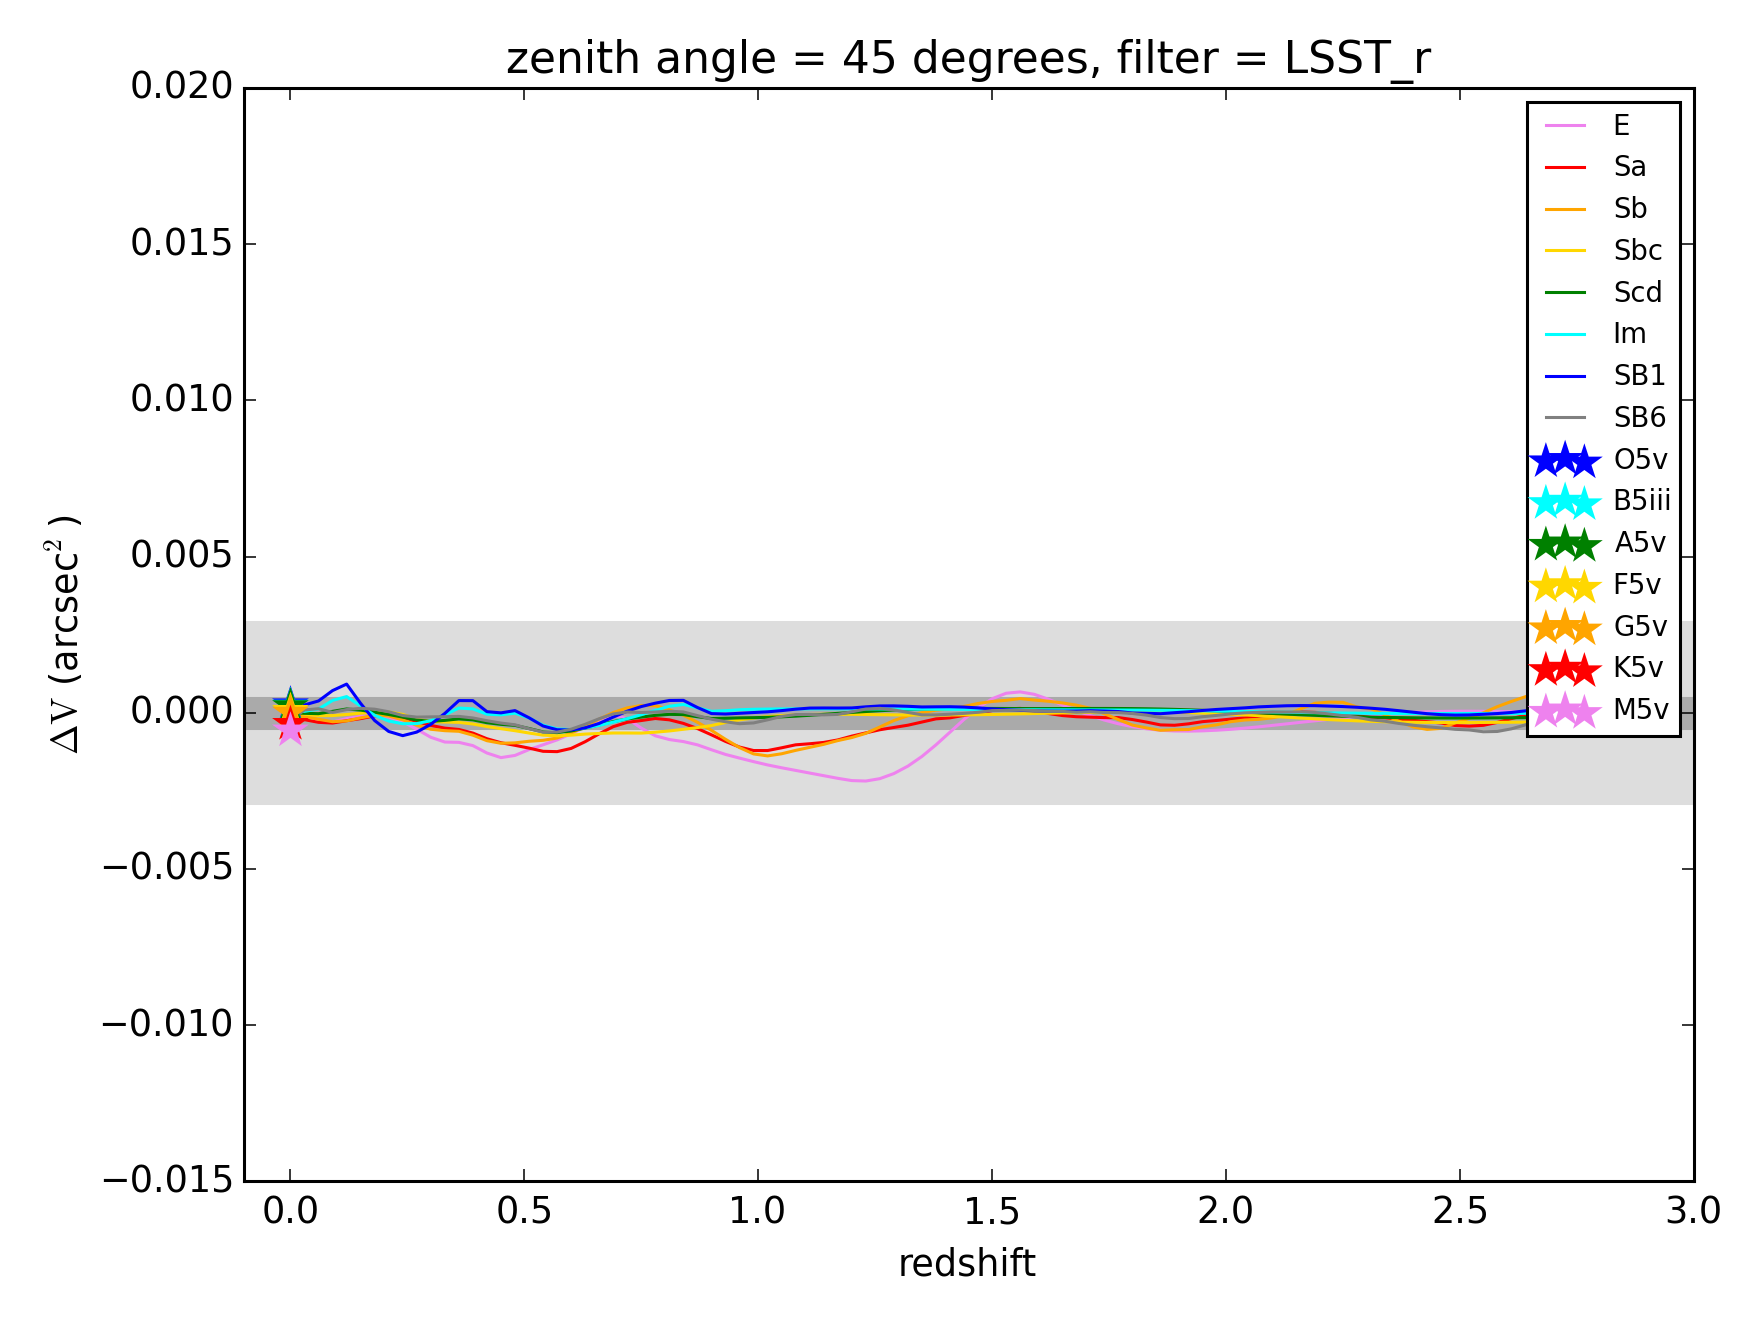
Similarly, the V*png figures show the DCR second moment shifts relative to a G5V star.
Finally, the S*png figures show the shift in PSF size, quantified as , due to chromatic seeing for the LSST filters, and due to a
Euclid-like relationship for the Euclid_350 filter.
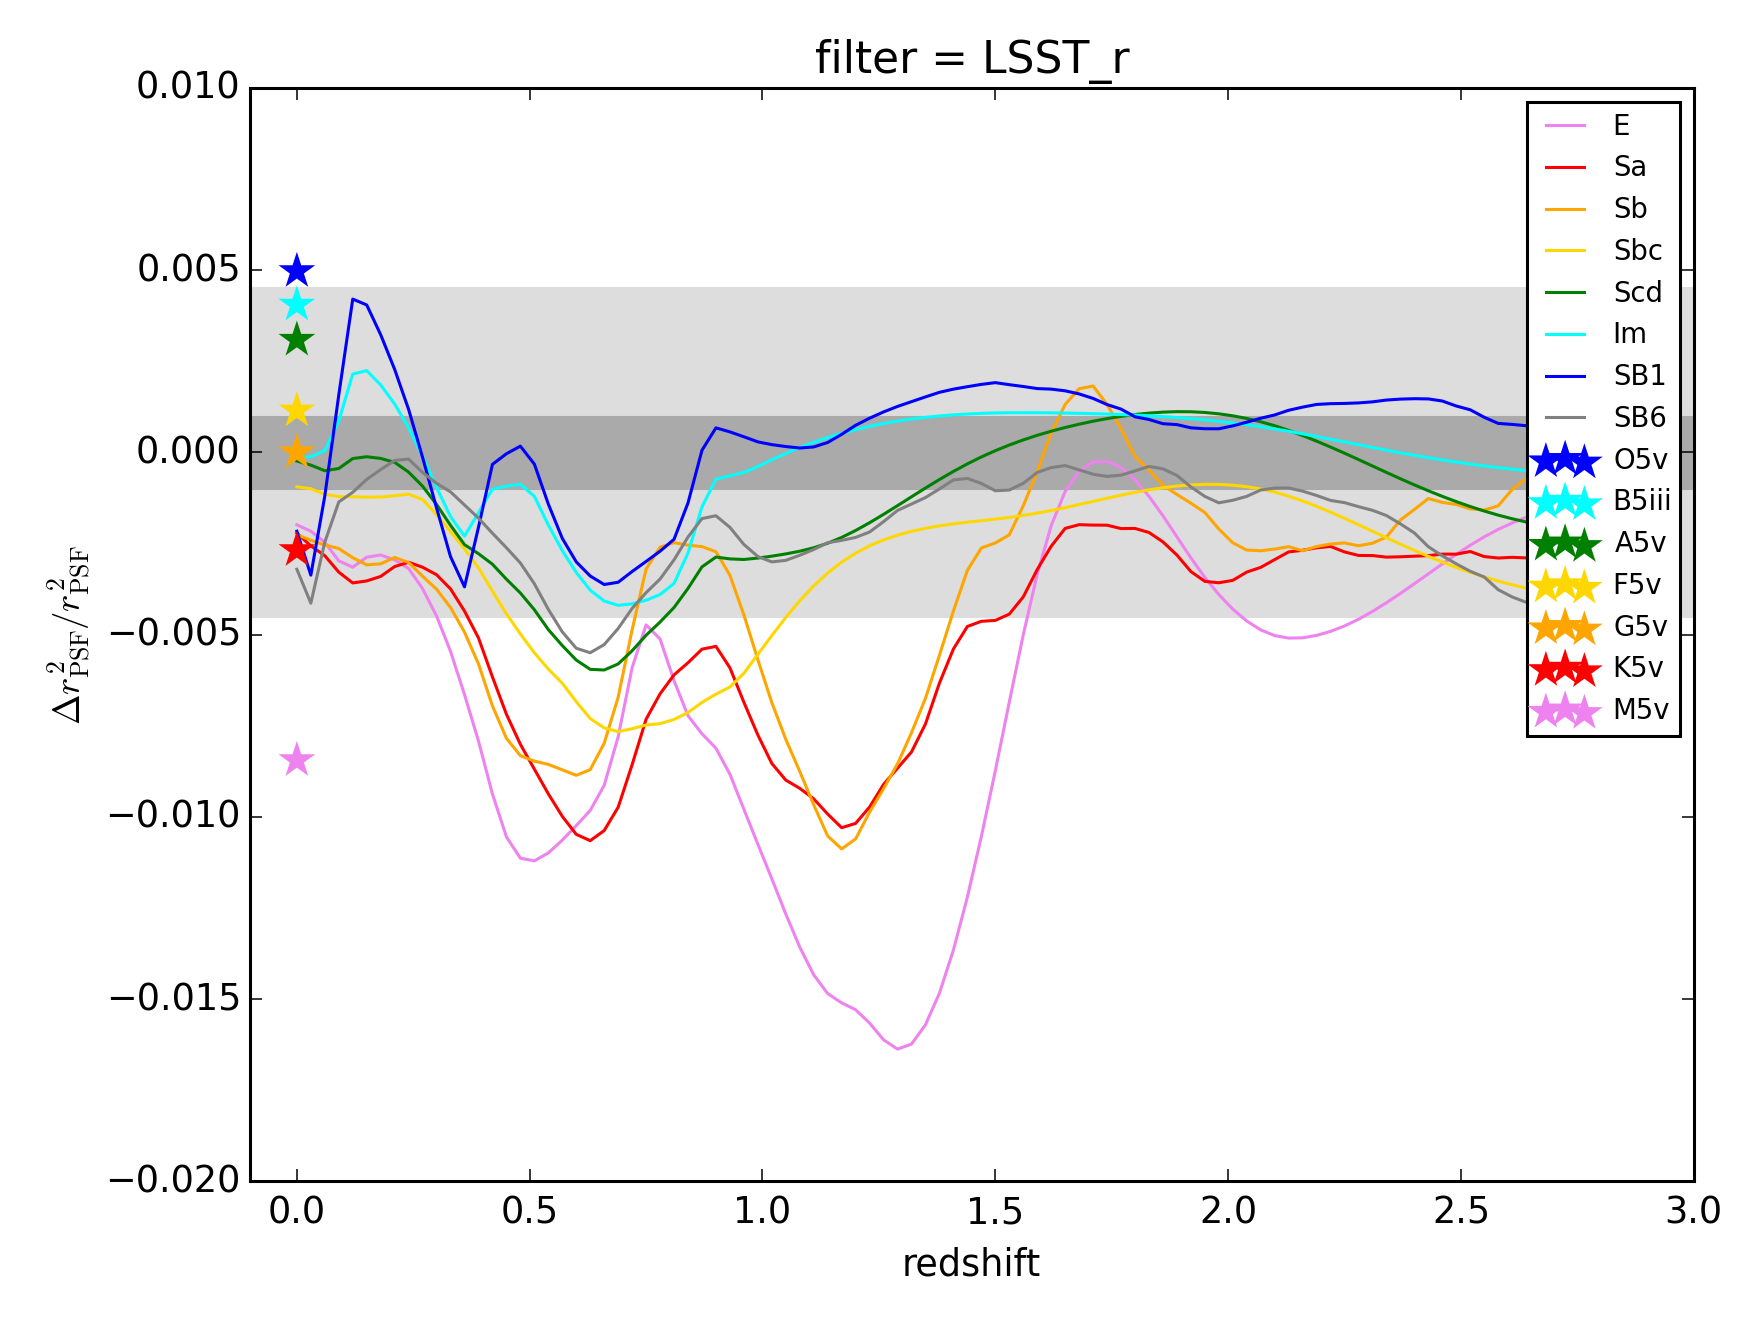
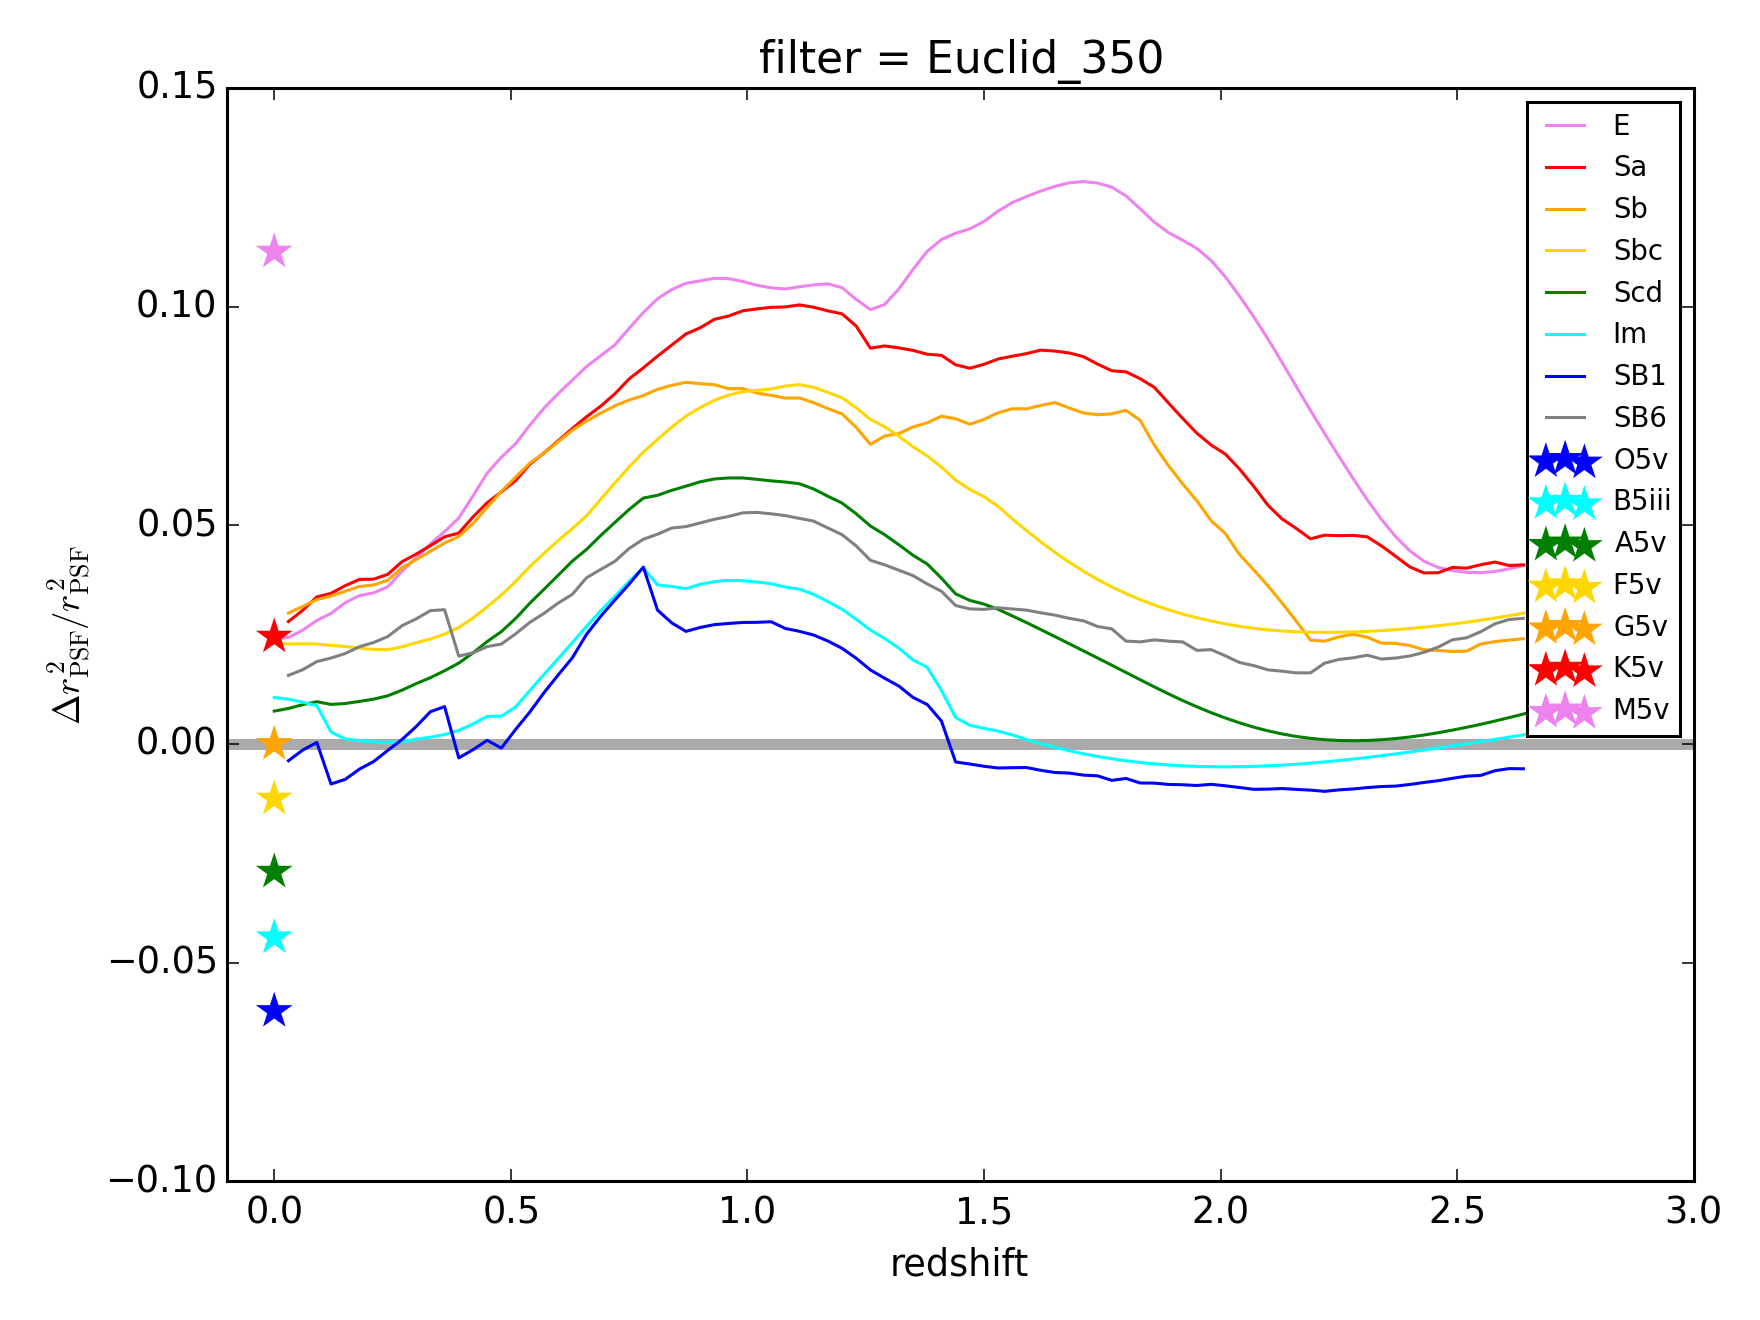
Except for PSF centroid (first moment) shifts, each of the above chromatic PSF shape or size biases either saturates or exceeds the systematic error budget of DES, LSST, and Euclid.