Color Corrections
Chromatic biases depend on the slope of the SED across the filter being imaged through. As such,
we might expect the biases to be correlated with the photometric colors of nearby bands. The
remaining Python scripts in the bin/analytic/ directory investigate this possibility:
$ cd CHROMA_DIR/bin/analytic/
$ python plot_DCR_color_corrections.py
$ python plot_PSF_size_color_corrections.py
$ ls output/*vs*png
output/Rbar_LSST_r_vs_LSST_r-LSST_i.png
output/V_LSST_r_vs_LSST_r-LSST_i.png
output/S_p06_Euclid_350_vs_LSST_r-LSST_i.png
output/S_m02_LSST_r_vs_LSST_r-LSST_i.png
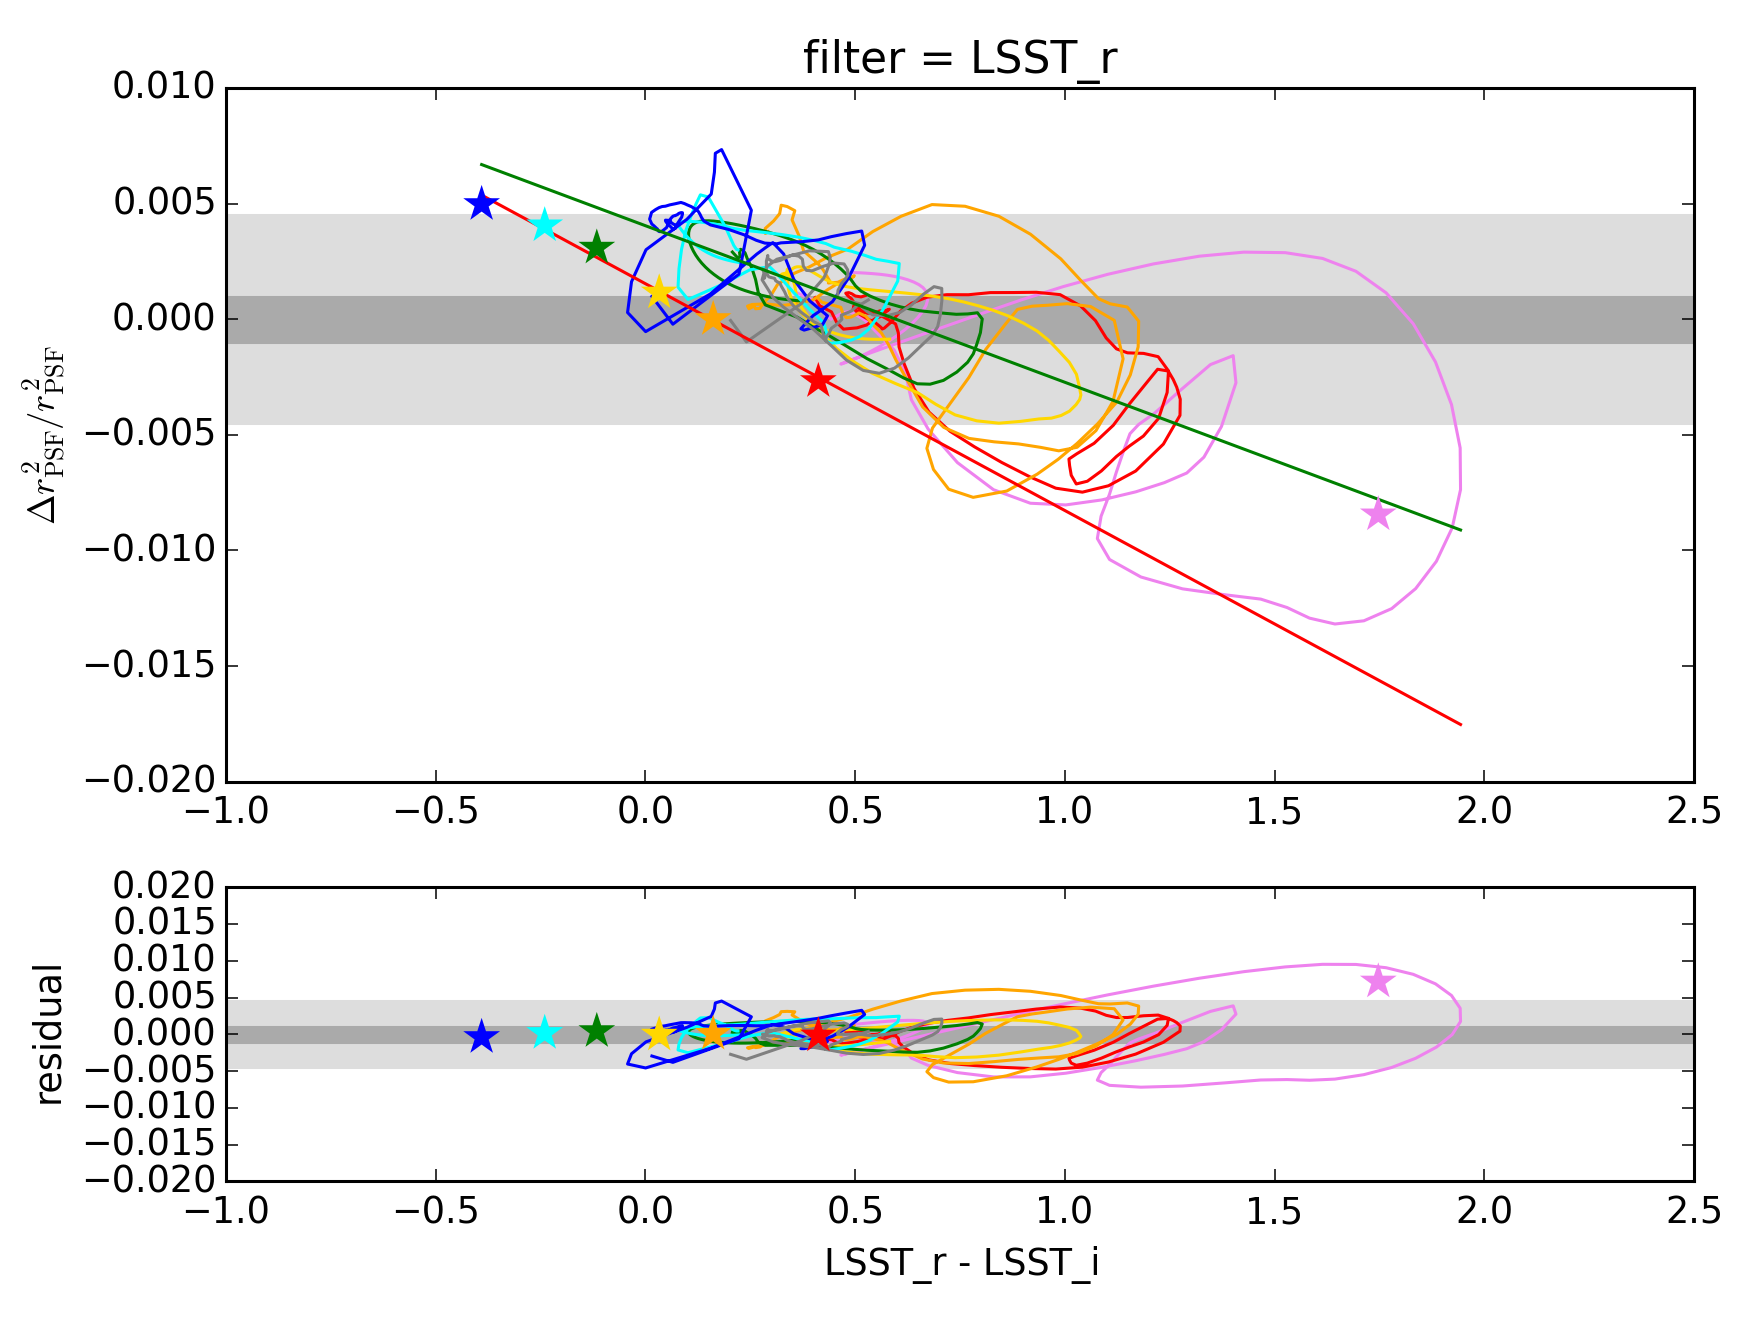
Let’s look at the chromatic seeing plot for LSST -band:

In the top panel, the same chromatic biases as on the previous page are being plotted on the y-axis, but the x-axis has been replaced with the LSST - color. Clearly there is a correlation. Using just the - color to make a correction, we get the bottom panel. The lines and star symbols here are much closer to landing within the requirement box than without a correction. Presumably, if we used all six photometric bands we could do better still. We will investigate this possibility shortly.
