Footprint functionality
Here we show how to use the footprint functionality. It is not used directly in the matching, but can be applied on the recovery rates computation
%load_ext autoreload
%autoreload 2
import numpy as np
import pylab as plt
import healpy as hp
Random data example
For display purposes, we will generate some quick random data to be used with the footprints.
# For reproducibility
np.random.seed(1)
from support import gen_cluster
input1, input2 = gen_cluster(ra_min=0, ra_max=30, dec_min=9, dec_max=30)
Initial number of clusters (logM>12.48): 2,740
Clusters in catalog1: 835
Clusters in catalog2: 928
from clevar import ClCatalog
tags = dict(ra='RA', dec='DEC', z='Z', mass='MASS',
            mass_err='MASS_ERR', z_err='Z_ERR',
            radius='RADIUS_ARCMIN')

c1 = ClCatalog('Cat1', data=input1, tags=tags, radius_unit='arcmin')
c2 = ClCatalog('Cat2', data=input2, tags=tags, radius_unit='arcmin')

# Format for nice display
for c in ('ra', 'dec', 'z', 'z_err', 'radius'):
    c1[c].info.format = '.2f'
    c2[c].info.format = '.2f'
for c in ('mass', 'mass_err'):
    c1[c].info.format = '.2e'
    c2[c].info.format = '.2e'
/home/aguena/.local/lib/python3.9/site-packages/clevar-0.13.2-py3.9.egg/clevar/catalog.py:267: UserWarning: id column missing, additional one is being created.
  warnings.warn(
Check position in healpix
Check what are the pixels that contain the clusters
nside = 32
pixels1 = hp.ang2pix(nside, c1['ra'], c1['dec'], lonlat=True)
pixels2 = hp.ang2pix(nside, c2['ra'], c2['dec'], lonlat=True)
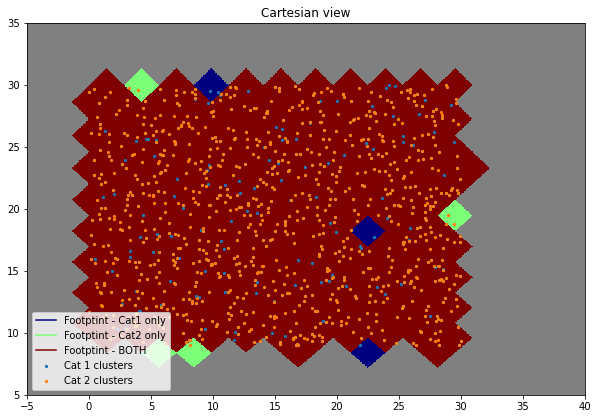
Plot to confirm selected pixels are correct
from matplotlib import cm
import copy
cmap = copy.copy(cm.jet)
cmap.set_under('.1')
gcol = lambda cmap, level: '#{:02x}{:02x}{:02x}{:02x}'.format(*cmap(level,bytes=True))

# Map with pixels of each catalog
map_ = np.zeros(hp.nside2npix(nside))
map_[pixels1] += 1
map_[pixels2] += 2
map_[map_==0] = np.nan

f = plt.figure(figsize=(10, 10))
hp.cartview(map_, hold=True, latra=[5, 35], lonra=[-5, 40], cmap=cmap, cbar=False, flip='geo')
ax = f.axes[0]
ax.axis('on')
ax.scatter(c1['ra'], c1['dec'], s=5, label='Cat 1 clusters')
ax.scatter(c2['ra'], c2['dec'], s=5, label='Cat 2 clusters')

ax.plot(0, 0, zorder=0, color=gcol(cmap, 0.0), label='Footptint - Cat1 only')
ax.plot(0, 0, zorder=0, color=gcol(cmap, 0.5), label='Footptint - Cat2 only')
ax.plot(0, 0, zorder=0, color=gcol(cmap, 1.0), label='Footptint - BOTH')
ax.legend(loc=3)
/home/aguena/miniconda3/envs/clmmenv/lib/python3.9/site-packages/healpy/projaxes.py:202: MatplotlibDeprecationWarning: Passing parameters norm and vmin/vmax simultaneously is deprecated since 3.3 and will become an error two minor releases later. Please pass vmin/vmax directly to the norm when creating it.
  aximg = self.imshow(
<matplotlib.legend.Legend at 0x7f33ef5896a0>
The Footprint object
ClEvaR uses the Footprint object to handle operations related to
spatial masking. It has the following internal attributes: - data:
Table with main footprint data (ex: pixel, detfrac, zmax) - tags:
Dictionary that tells which are the default columns to be used -
size: Number of pixels in the catalog - pixel_dict: Dictionary
of indicies given the object pixel
from clevar.footprint import Footprint
Adding external data to footprint
The input data for the footprint is the following:
nside(int): Heapix NSIDEnest(bool): If ordering is nested (default=False)pixel(array): Pixels inside the footprintdetfrac_vals(array, None): Detection fraction, if None is set to 1zmax_vals(array, None): Zmax, if None is set to 99
Just like the ClCatalog object, data in Footorint can be added
from columns, a dictionary or a table. First, let’s create some input
data:
# Random values for detfrac and zmax for ftpt1
set_pixels1 = list(set(pixels1))
set_pixels2 = list(set(pixels2))
detfrac_rand = 0.9+.1*np.random.rand(len(set_pixels1))
z_rand = 0.5+.5*np.random.rand(len(set_pixels1))
From columns
To create a footprint fom columns, you have to pass the name as the initial argument and the data columns for the table as keyword arguments:
ftpt1 = Footprint(nside=nside, pixel=set_pixels1, detfrac=detfrac_rand, zmax=z_rand)
ftpt1[:5]
| pixel | detfrac | zmax |
|---|---|---|
| int64 | float64 | float64 |
| 4681 | 0.9063345330078498 | 0.5603701608159029 |
| 5190 | 0.951647091119141 | 0.7147891228605607 |
| 4682 | 0.9020547775560774 | 0.9995254135867374 |
| 5192 | 0.9388815488596242 | 0.5046096565358194 |
| 5194 | 0.9673579833430996 | 0.7466031661083729 |
You can also pass a tags dictionary as input if you want your
catalog to have names that are not default for ClEvaR use:
ftpt1 = Footprint(nside=nside, hpix=set_pixels1, df=detfrac_rand, zm=z_rand,
                 tags={'pixel': 'hpix', 'detfrac':'df', 'zmax': 'zm'})
ftpt1[:5]
| hpix (pixel) | df (detfrac) | zm (zmax) |
|---|---|---|
| int64 | float64 | float64 |
| 4681 | 0.9063345330078498 | 0.5603701608159029 |
| 5190 | 0.951647091119141 | 0.7147891228605607 |
| 4682 | 0.9020547775560774 | 0.9995254135867374 |
| 5192 | 0.9388815488596242 | 0.5046096565358194 |
| 5194 | 0.9673579833430996 | 0.7466031661083729 |
From data table
You can also create a ClCatalog passing directly a full data table:
from astropy.table import Table
ap_table = Table([set_pixels1, detfrac_rand], names=['hpix', 'df'])
ftpt1 = Footprint(nside=32, data=ap_table, tags={'pixel': 'hpix', 'detfrac':'df'})
ftpt1[:3]
| hpix (pixel) | df (detfrac) | zmax |
|---|---|---|
| int64 | float64 | float64 |
| 4681 | 0.9063345330078498 | 99.0 |
| 5190 | 0.951647091119141 | 99.0 |
| 4682 | 0.9020547775560774 | 99.0 |
The data table can also be a dictionary or a numpy array with names:
# default colnames
print('default colnames:')
ftpt1 = Footprint(nside=32, data={'pixel': set_pixels1, 'detfrac': detfrac_rand})
display(ftpt1[:3])


print('different colnames:')
# different colnames
ftpt1 = Footprint(nside=32, data={'hpix': set_pixels1, 'df': detfrac_rand},
                  tags={'pixel': 'hpix', 'detfrac':'df'})
display(ftpt1[:3])
default colnames:
| pixel | detfrac | zmax |
|---|---|---|
| int64 | float64 | float64 |
| 4681 | 0.9063345330078498 | 99.0 |
| 5190 | 0.951647091119141 | 99.0 |
| 4682 | 0.9020547775560774 | 99.0 |
different colnames:
| hpix (pixel) | df (detfrac) | zmax |
|---|---|---|
| int64 | float64 | float64 |
| 4681 | 0.9063345330078498 | 99.0 |
| 5190 | 0.951647091119141 | 99.0 |
| 4682 | 0.9020547775560774 | 99.0 |
# default colnames
print('default colnames:')
np_table = np.array(list(zip(set_pixels1, detfrac_rand)),
                    dtype=[('pixel', 'f4'), ('detfrac', 'f4')])
ftpt1 = Footprint(nside=32, data=np_table)
display(ftpt1[:3])


print('different colnames:')
# different colnames
np_table = np.array(list(zip(set_pixels1, detfrac_rand)),
                    dtype=[('hpix', 'f4'), ('df', 'f4')])
ftpt1 = Footprint(nside=32, data=np_table,
                  tags={'pixel': 'hpix', 'detfrac':'df'})
display(ftpt1[:3])
default colnames:
| pixel | detfrac | zmax |
|---|---|---|
| int64 | float32 | float64 |
| 4681 | 0.9063345 | 99.0 |
| 5190 | 0.9516471 | 99.0 |
| 4682 | 0.9020548 | 99.0 |
different colnames:
| hpix (pixel) | df (detfrac) | zmax |
|---|---|---|
| int64 | float32 | float64 |
| 4681 | 0.9063345 | 99.0 |
| 5190 | 0.9516471 | 99.0 |
| 4682 | 0.9020548 | 99.0 |
Read the footprint from fits file
To read the footprint, the arguments are:
filename(str): Name of.fitscatalognside(int): Heapix NSIDEtags(dict): Dictionary with the tags and column names. It must containpixel(str): Name of pixels column inside the footprintdetfrac(str): Name of detection fraction column, if None is set to 1zmax(str): Name of Zmax column, if None is set to 99
nest(bool): If ordering is nested (default=False)full(bool): read all columns of file
Let’s first create a file with the footprint info:
Footprint(nside=nside, pixel=set_pixels1, detfrac=detfrac_rand, zmax=z_rand).write('ftpt_temp.fits')
and then read it:
Footprint.read('ftpt_temp.fits', nside=nside,
               tags={'pixel': 'pixel',
                     'detfrac': 'detfrac',
                     'zmax': 'zmax'})[:3]
| pixel | detfrac | zmax |
|---|---|---|
| int64 | float64 | float64 |
| 4681 | 0.9063345330078498 | 0.5603701608159029 |
| 5190 | 0.951647091119141 | 0.7147891228605607 |
| 4682 | 0.9020547775560774 | 0.9995254135867374 |
Footprint.read('ftpt_temp.fits', nside=nside,
               tags={'pixel': 'pixel'})[:3]
| pixel | detfrac | zmax |
|---|---|---|
| int64 | float64 | float64 |
| 4681 | 1.0 | 99.0 |
| 5190 | 1.0 | 99.0 |
| 4682 | 1.0 | 99.0 |
Footprint.read('ftpt_temp.fits', nside=nside,
               tags={'pixel': 'pixel'}, full=True)[:3]
| pixel | detfrac | zmax |
|---|---|---|
| int64 | float64 | float64 |
| 4681 | 0.9063345330078498 | 0.5603701608159029 |
| 5190 | 0.951647091119141 | 0.7147891228605607 |
| 4682 | 0.9020547775560774 | 0.9995254135867374 |
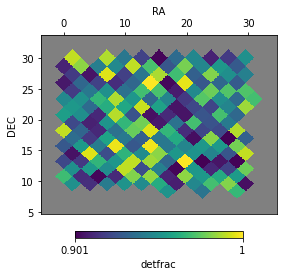
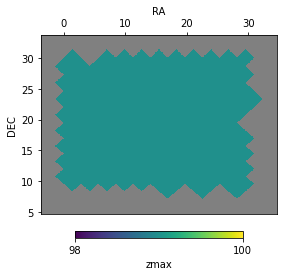
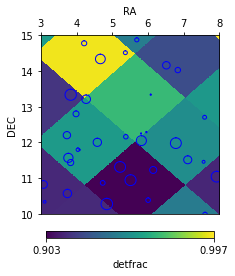
Plotting the footprint
The footprints have an inbuilt function to plot their values
f = ftpt1.plot('detfrac', bad_val=np.nan, auto_lim=True)
f = ftpt1.plot('zmax', bad_val=np.nan, auto_lim=True)
/home/aguena/miniconda3/envs/clmmenv/lib/python3.9/site-packages/healpy/projaxes.py:920: MatplotlibDeprecationWarning: You are modifying the state of a globally registered colormap. In future versions, you will not be able to modify a registered colormap in-place. To remove this warning, you can make a copy of the colormap first. cmap = copy.copy(mpl.cm.get_cmap("viridis"))
  newcm.set_over(newcm(1.0))
/home/aguena/miniconda3/envs/clmmenv/lib/python3.9/site-packages/healpy/projaxes.py:921: MatplotlibDeprecationWarning: You are modifying the state of a globally registered colormap. In future versions, you will not be able to modify a registered colormap in-place. To remove this warning, you can make a copy of the colormap first. cmap = copy.copy(mpl.cm.get_cmap("viridis"))
  newcm.set_under(bgcolor)
/home/aguena/miniconda3/envs/clmmenv/lib/python3.9/site-packages/healpy/projaxes.py:922: MatplotlibDeprecationWarning: You are modifying the state of a globally registered colormap. In future versions, you will not be able to modify a registered colormap in-place. To remove this warning, you can make a copy of the colormap first. cmap = copy.copy(mpl.cm.get_cmap("viridis"))
  newcm.set_bad(badcolor)
/home/aguena/miniconda3/envs/clmmenv/lib/python3.9/site-packages/healpy/projaxes.py:202: MatplotlibDeprecationWarning: Passing parameters norm and vmin/vmax simultaneously is deprecated since 3.3 and will become an error two minor releases later. Please pass vmin/vmax directly to the norm when creating it.
  aximg = self.imshow(
Clusters can also be added to the plot with their actual angular size:
# increase cluster radius for display
c1['radius'] *= 10
f = ftpt1.plot('detfrac', bad_val=np.nan,
               ra_lim=[3, 8], dec_lim=[10, 15],
               cluster=c1)
# return original value
c1['radius'] /= 10
Use ClEvaR functions to create a footprint
Import create_footprint functions to create a footprint based on a
cluster catalog. It can create a footprint based on cluster positions
with a given NSIDE, or compute the best NSIDE based on a cluster
density per pixel. It also can fill holes in the footprint.
from clevar.footprint import create_artificial_footprint
Fixed NSIDE:
ftpt1 = create_artificial_footprint(c1['ra'], c1['dec'], nside=64)
Footprint NSIDE: 64
Pixels in footprint: 506
Pixels in footprint: 506
NSIDE from density:
ftpt1 = create_artificial_footprint(c1['ra'], c1['dec'], nside=None, min_density=4)
NSIDE(2) -> 208.75 clusters per pixel
NSIDE(4) -> 139.16666666666666 clusters per pixel
NSIDE(8) -> 46.388888888888886 clusters per pixel
NSIDE(16) -> 14.910714285714286 clusters per pixel
NSIDE(32) -> 4.417989417989418 clusters per pixel
NSIDE(64) -> 1.650197628458498 clusters per pixel
Footprint NSIDE: 64
Pixels in footprint: 506
Pixels in footprint: 506
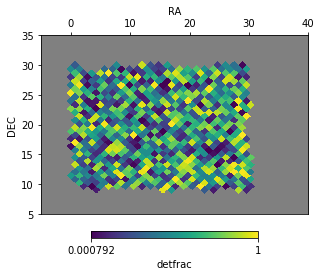
there is also an option to fill holes in this artificial footprint
ftpt1 = create_artificial_footprint(c1['ra'], c1['dec'], nside=64, neighbor_fill=5)
Footprint NSIDE: 64
Pixels in footprint: 506
### filling holes ###
 - filling
   size: 506 -> 673 (+167)
 - filling
   size: 673 -> 697 (+24)
 - filling
   size: 697 -> 699 (+2)
 - filling
   size: 699 -> 700 (+1)
 - filling
   size: 700 -> 700 (+0)
 Total Change:
   size: 506 -> 700 (+194)
### filled! ###
Pixels in footprint: 700
ftpt1['detfrac'] = np.random.rand(ftpt1.size)
f = ftpt1.plot('detfrac', np.nan,  latra=[5, 35], lonra=[-5, 40])
/home/aguena/miniconda3/envs/clmmenv/lib/python3.9/site-packages/healpy/projaxes.py:920: MatplotlibDeprecationWarning: You are modifying the state of a globally registered colormap. In future versions, you will not be able to modify a registered colormap in-place. To remove this warning, you can make a copy of the colormap first. cmap = copy.copy(mpl.cm.get_cmap("viridis"))
  newcm.set_over(newcm(1.0))
/home/aguena/miniconda3/envs/clmmenv/lib/python3.9/site-packages/healpy/projaxes.py:921: MatplotlibDeprecationWarning: You are modifying the state of a globally registered colormap. In future versions, you will not be able to modify a registered colormap in-place. To remove this warning, you can make a copy of the colormap first. cmap = copy.copy(mpl.cm.get_cmap("viridis"))
  newcm.set_under(bgcolor)
/home/aguena/miniconda3/envs/clmmenv/lib/python3.9/site-packages/healpy/projaxes.py:922: MatplotlibDeprecationWarning: You are modifying the state of a globally registered colormap. In future versions, you will not be able to modify a registered colormap in-place. To remove this warning, you can make a copy of the colormap first. cmap = copy.copy(mpl.cm.get_cmap("viridis"))
  newcm.set_bad(badcolor)
/home/aguena/miniconda3/envs/clmmenv/lib/python3.9/site-packages/healpy/projaxes.py:202: MatplotlibDeprecationWarning: Passing parameters norm and vmin/vmax simultaneously is deprecated since 3.3 and will become an error two minor releases later. Please pass vmin/vmax directly to the norm when creating it.
  aximg = self.imshow(
Footprint masks
Add masks to clusters regarding the footprint. The ClCatalog object
has has 3 functions related to the footprint: - add_ftpt_masks: info
for cluster in footprint - add_ftpt_coverfrac: computes cover
fraction - add_ftpt_coverfrac_nfw2D: computes cover fraction
weighted by a project NFW profile
ftpt1 = Footprint(nside=nside, pixel=set_pixels1, detfrac=detfrac_rand, zmax=z_rand)
ftpt2 = Footprint(nside=nside, pixel=set_pixels2)
ftpt2['detfrac'][::2] = .5 # add effects to this footprint
%%time
c1.add_ftpt_masks(ftpt1, ftpt2)
c2.add_ftpt_masks(ftpt2, ftpt1)
## creating visibility mask ##
## creating visibility mask ##
## creating visibility mask ##
## creating visibility mask ##
CPU times: user 15.5 ms, sys: 31.8 ms, total: 47.2 ms
Wall time: 15.7 ms
display(c1[:4])
display(c2[:4])
tags: id(id), RA(ra), DEC(dec), Z(z), MASS(mass), MASS_ERR(mass_err), Z_ERR(z_err), RADIUS_ARCMIN(radius)
Radius unit: arcmin
| id | RA (ra) | DEC (dec) | Z (z) | RADIUS_ARCMIN (radius) | MASS (mass) | MASS_ERR (mass_err) | Z_ERR (z_err) | mt_self | mt_other | mt_multi_self | mt_multi_other | ft_self | ft_other |
|---|---|---|---|---|---|---|---|---|---|---|---|---|---|
| str3 | float64 | float64 | float64 | float64 | float64 | float64 | float64 | object | object | object | object | bool | bool |
| 0 | 12.58 | 23.60 | 1.53 | 0.94 | 1.00e+13 | 3.69e+12 | 0.08 | None | None | [] | [] | False | True |
| 1 | 6.13 | 23.17 | 0.33 | 0.48 | 1.57e+13 | 4.29e+12 | 0.04 | None | None | [] | [] | True | True |
| 2 | 12.52 | 10.82 | 0.78 | 0.84 | 1.49e+13 | 6.11e+12 | 0.07 | None | None | [] | [] | False | True |
| 3 | 4.21 | 14.78 | 1.01 | 0.42 | 1.13e+13 | 4.71e+12 | 0.06 | None | None | [] | [] | False | True |
tags: id(id), RA(ra), DEC(dec), Z(z), MASS(mass), MASS_ERR(mass_err), Z_ERR(z_err), RADIUS_ARCMIN(radius)
Radius unit: arcmin
| id | RA (ra) | DEC (dec) | Z (z) | RADIUS_ARCMIN (radius) | MASS (mass) | MASS_ERR (mass_err) | Z_ERR (z_err) | mt_self | mt_other | mt_multi_self | mt_multi_other | ft_self | ft_other |
|---|---|---|---|---|---|---|---|---|---|---|---|---|---|
| str3 | float64 | float64 | float64 | float64 | float64 | float64 | float64 | object | object | object | object | bool | bool |
| 0 | 12.58 | 23.60 | 1.51 | 0.94 | 1.12e+13 | 3.69e+12 | 0.08 | None | None | [] | [] | True | False |
| 1 | 6.13 | 23.17 | 0.33 | 0.48 | 2.35e+13 | 4.29e+12 | 0.04 | None | None | [] | [] | True | True |
| 2 | 12.52 | 10.82 | 0.80 | 0.84 | 1.36e+13 | 6.11e+12 | 0.07 | None | None | [] | [] | True | False |
| 3 | 4.21 | 14.78 | 0.99 | 0.42 | 1.71e+13 | 4.71e+12 | 0.06 | None | None | [] | [] | True | False |
Add coverfraction values based on the footprint. It needs a cosmology object.
from clevar.cosmology import AstroPyCosmology
cosmo = AstroPyCosmology()
%%time
c1.add_ftpt_coverfrac(ftpt2, 1, 'mpc', cosmo=cosmo, window='flat')
c1.add_ftpt_coverfrac(ftpt2, 1, 'mpc', cosmo=cosmo, window='nfw2D')
c2.add_ftpt_coverfrac(ftpt1, 1, 'mpc', cosmo=cosmo, window='nfw2D')
CPU times: user 8.31 s, sys: 19.5 ms, total: 8.33 s
Wall time: 8.29 s
display(c1[:4])
display(c2[:4])
tags: id(id), RA(ra), DEC(dec), Z(z), MASS(mass), MASS_ERR(mass_err), Z_ERR(z_err), RADIUS_ARCMIN(radius)
Radius unit: arcmin
| id | RA (ra) | DEC (dec) | Z (z) | RADIUS_ARCMIN (radius) | MASS (mass) | MASS_ERR (mass_err) | Z_ERR (z_err) | mt_self | mt_other | mt_multi_self | mt_multi_other | ft_self | ft_other | cf_1_mpc | cf_nfw_1_mpc |
|---|---|---|---|---|---|---|---|---|---|---|---|---|---|---|---|
| str3 | float64 | float64 | float64 | float64 | float64 | float64 | float64 | object | object | object | object | bool | bool | float64 | float64 |
| 0 | 12.58 | 23.60 | 1.53 | 0.94 | 1.00e+13 | 3.69e+12 | 0.08 | None | None | [] | [] | False | True | 0.8333333333333334 | 0.7741572794115797 |
| 1 | 6.13 | 23.17 | 0.33 | 0.48 | 1.57e+13 | 4.29e+12 | 0.04 | None | None | [] | [] | True | True | 0.5 | 0.5 |
| 2 | 12.52 | 10.82 | 0.78 | 0.84 | 1.49e+13 | 6.11e+12 | 0.07 | None | None | [] | [] | False | True | 0.75 | 0.7260951172194341 |
| 3 | 4.21 | 14.78 | 1.01 | 0.42 | 1.13e+13 | 4.71e+12 | 0.06 | None | None | [] | [] | False | True | 1.0 | 1.0 |
tags: id(id), RA(ra), DEC(dec), Z(z), MASS(mass), MASS_ERR(mass_err), Z_ERR(z_err), RADIUS_ARCMIN(radius)
Radius unit: arcmin
| id | RA (ra) | DEC (dec) | Z (z) | RADIUS_ARCMIN (radius) | MASS (mass) | MASS_ERR (mass_err) | Z_ERR (z_err) | mt_self | mt_other | mt_multi_self | mt_multi_other | ft_self | ft_other | cf_nfw_1_mpc |
|---|---|---|---|---|---|---|---|---|---|---|---|---|---|---|
| str3 | float64 | float64 | float64 | float64 | float64 | float64 | float64 | object | object | object | object | bool | bool | float64 |
| 0 | 12.58 | 23.60 | 1.51 | 0.94 | 1.12e+13 | 3.69e+12 | 0.08 | None | None | [] | [] | True | False | 0.0 |
| 1 | 6.13 | 23.17 | 0.33 | 0.48 | 2.35e+13 | 4.29e+12 | 0.04 | None | None | [] | [] | True | True | 0.9664374259818176 |
| 2 | 12.52 | 10.82 | 0.80 | 0.84 | 1.36e+13 | 6.11e+12 | 0.07 | None | None | [] | [] | True | False | 0.4350822741933005 |
| 3 | 4.21 | 14.78 | 0.99 | 0.42 | 1.71e+13 | 4.71e+12 | 0.06 | None | None | [] | [] | True | False | 0.0 |
Saving and loading footprint quantities
ClEvaR has internal functions to save and load these quantities into
the catalog so you don’t have to compute them again:
c1.save_footprint_quantities('cat1_ft_quantities.fits', overwrite=True)
c1.load_footprint_quantities('cat1_ft_quantities.fits')
Application of footprint flags on recovery rate
The recovery rate of clusters should take into account the footprint of
the catalogs. Regions without overlaps should not be taken into
consideration. Here we show how this can be done with ClEvaR.
Match catalogs
Let’s match the catalogs to compute the recovery rate
from clevar.match import ProximityMatch
match_config = {
    'type': 'cross', # options are cross, cat1, cat2
    'which_radius': 'max', # Case of radius to be used, can be: cat1, cat2, min, max
    'preference': 'angular_proximity', # options are more_massive, angular_proximity or redshift_proximity
    'catalog1': {'delta_z':.2,
                'match_radius': '1 mpc'},
    'catalog2': {'delta_z':.2,
                'match_radius': '10 arcsec'}
}
%%time
mt = ProximityMatch()
mt.match_from_config(c1, c2, match_config, cosmo=cosmo)
## ClCatalog 1
## Prep mt_cols
* zmin|zmax from config value
* ang radius from set scale

## ClCatalog 2
## Prep mt_cols
* zmin|zmax from config value
* ang radius from set scale

## Multiple match (catalog 1)
Finding candidates (Cat1)
* 719/835 objects matched.

## Multiple match (catalog 2)
Finding candidates (Cat2)
* 721/928 objects matched.

## Finding unique matches of catalog 1
Unique Matches (Cat1)
* 719/835 objects matched.

## Finding unique matches of catalog 2
Unique Matches (Cat2)
* 720/928 objects matched.
Cross Matches (Cat1)
* 719/835 objects matched.
Cross Matches (Cat2)
* 719/928 objects matched.
CPU times: user 18.5 s, sys: 209 ms, total: 18.7 s
Wall time: 18.5 s
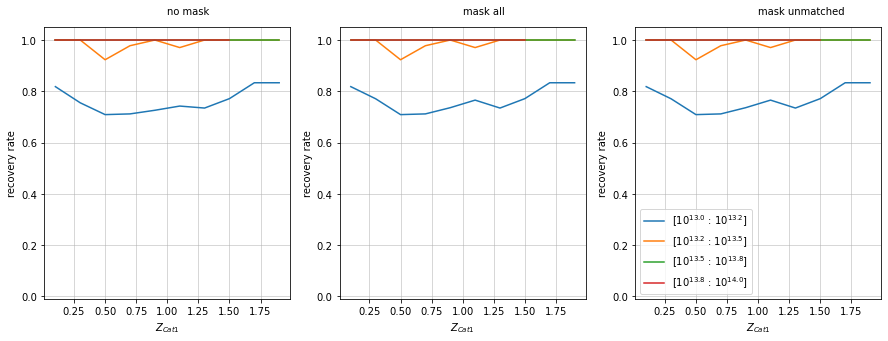
Recovery rate
Use pass the parameters mask (masks all clusters) or
mask_unmatched (masks only unmatched clusters) to consider only
specific clusters on the recovery rate. This way, you can exclude
clusters outside the common regions from the consideration.
from clevar.match_metrics import recovery
zbins = np.linspace(0, 2, 11)
mbins = np.logspace(13, 14, 5)
Mask based on footprint overlap
f, axes = plt.subplots(1, 3, figsize=(15, 5))
recovery.plot(c1, 'cross', zbins, mbins, ax=axes[0], add_legend=False, shape='line')
recovery.plot(c1, 'cross', zbins, mbins, ax=axes[1], add_legend=False,
              mask=c1['ft_other'], shape='line')
recovery.plot(c1, 'cross', zbins, mbins, ax=axes[2],
              mask_unmatched=~c1['ft_other'], shape='line')
for ax in axes:
    ax.set_ylim(-.01, 1.05)
axes[0].text(1, 1.1, 'no mask')
axes[1].text(1, 1.1, 'mask all')
axes[2].text(1, 1.1, 'mask unmatched')
plt.show()
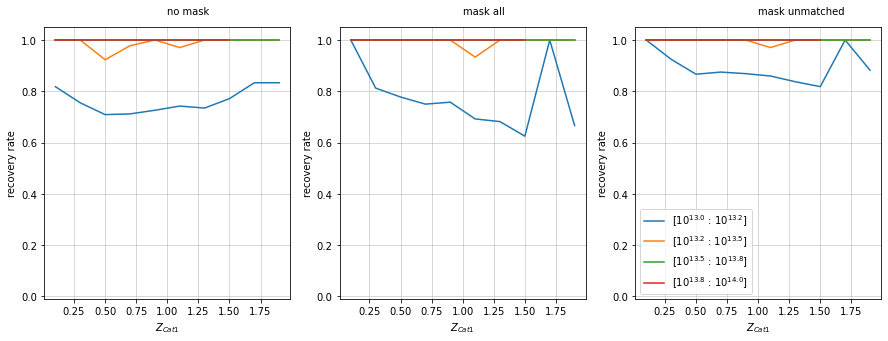
Mask based on coverfraction
f, axes = plt.subplots(1, 3, figsize=(15, 5))
recovery.plot(c1, 'cross', zbins, mbins, ax=axes[0], add_legend=False, shape='line')
recovery.plot(c1, 'cross', zbins, mbins, ax=axes[1], add_legend=False,
              mask=c1['cf_nfw_1_mpc']>.8, shape='line')
recovery.plot(c1, 'cross', zbins, mbins, ax=axes[2],
              mask_unmatched=c1['cf_nfw_1_mpc']<.8, shape='line')
for ax in axes:
    ax.set_ylim(-.01, 1.05)
axes[0].text(1, 1.1, 'no mask')
axes[1].text(1, 1.1, 'mask all')
axes[2].text(1, 1.1, 'mask unmatched')
plt.show()
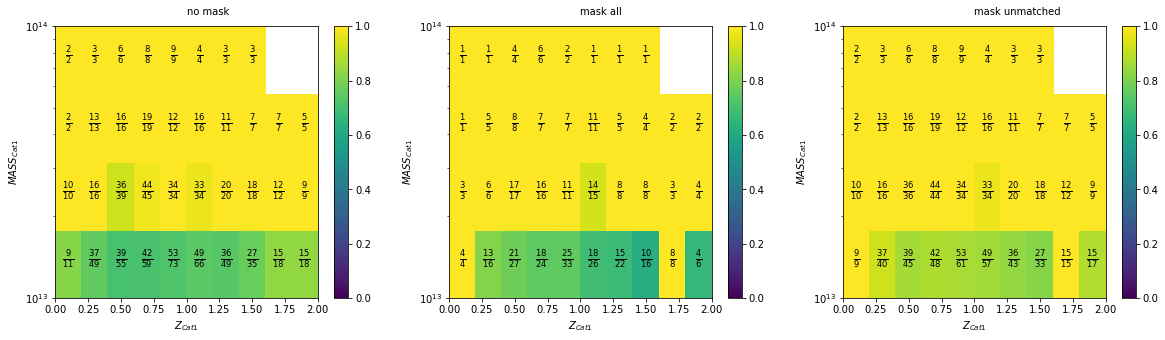
You can check the exact numbers used on the 2D plots
f, axes = plt.subplots(1, 3, figsize=(20, 5))

recovery.plot2D(c1, 'cross', zbins, mbins, ax=axes[0],
                add_num=True, num_kwargs={'fontsize':12
                                         })
recovery.plot2D(c1, 'cross', zbins, mbins, ax=axes[1],
                add_num=True, num_kwargs={'fontsize':12},
               mask=c1['cf_nfw_1_mpc']>.8)
recovery.plot2D(c1, 'cross', zbins, mbins, ax=axes[2],
                add_num=True, num_kwargs={'fontsize':12},
               mask_unmatched=c1['cf_nfw_1_mpc']<.8)
axes[0].text(1, mbins[-1]*1.1,'no mask')
axes[1].text(1, mbins[-1]*1.1,'mask all')
axes[2].text(1, mbins[-1]*1.1,'mask unmatched')

plt.show()