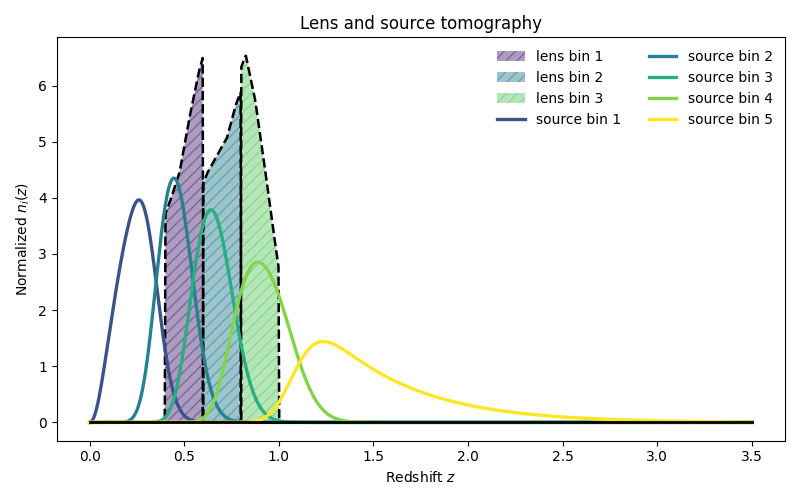
Tomography
DSF uses Binny to build lens and source tomography for Delta Sigma forecasts. Binny owns the survey presets, redshift distributions, tomographic binning, bin summaries, densities, and pair filtering inputs. DSF then uses these tomography products to select the lens-source bin pairs needed for the forecast.
This example builds DESI LRG lens tomography and LSST Y1 source tomography. It uses three DESI lens bins, prints the selected lens-source bin pairs, prints the lens and source bin centers, and plots the tomographic redshift distributions.
The selected pairs use two cuts:
source_behind_lens=Truekeeps only pairs where the source-bin center is larger than the lens-bin center.overlap_threshold=0.10rejects pairs whose fractional redshift-distribution overlap is larger than ten percent.
from pathlib import Path

import matplotlib.pyplot as plt
import numpy as np

from dsf.tomography.tomo_builder import TomographyBuilder


def plot_lens_and_source_bins(
    lens_result,
    source_result,
    *,
    save_path=None,
    figsize=None,
    dpi=300,
):
    """Plot lens and source tomographic redshift distributions."""
    if figsize is None:
        fig, ax = plt.subplots()
    else:
        fig, ax = plt.subplots(figsize=figsize)

    z_lens = np.asarray(lens_result.z).reshape(-1)
    z_source = np.asarray(source_result.z).reshape(-1)

    lens_keys = sorted(lens_result.bins)
    source_keys = sorted(source_result.bins)

    lens_colors = plt.cm.viridis(np.linspace(0.10, 0.75, len(lens_keys)))
    source_colors = plt.cm.viridis(np.linspace(0.25, 1.00, len(source_keys)))

    for i, (key, color) in enumerate(zip(lens_keys, lens_colors, strict=True)):
        nz = np.asarray(lens_result.bins[key]).reshape(-1)

        ax.fill_between(
            z_lens,
            0.0,
            nz,
            facecolor=color,
            edgecolor=color,
            hatch="///",
            alpha=0.45,
            linewidth=0.0,
            zorder=10 + i,
            label=f"lens bin {key + 1}",
        )

        ax.plot(
            z_lens,
            nz,
            color="k",
            linewidth=1.8,
            linestyle="--",
            zorder=20 + i,
        )

    for i, (key, color) in enumerate(zip(source_keys, source_colors, strict=True)):
        nz = np.asarray(source_result.bins[key]).reshape(-1)

        ax.plot(
            z_source,
            nz,
            color=color,
            linewidth=2.4,
            zorder=40 + i,
            label=f"source bin {key + 1}",
        )

        ax.plot(
            z_source,
            nz,
            color="k",
            linewidth=0.8,
            alpha=0.55,
            zorder=39 + i,
        )

    z_min = min(np.min(z_lens), np.min(z_source))
    z_max = max(np.max(z_lens), np.max(z_source))

    ax.plot(
        [z_min, z_max],
        [0.0, 0.0],
        color="k",
        linewidth=2.0,
        zorder=1000,
    )

    ax.set_title("Lens and source tomography")
    ax.set_xlabel(r"Redshift $z$")
    ax.set_ylabel(r"Normalized $n_i(z)$")
    ax.legend(frameon=False, ncol=2)

    fig.tight_layout()

    if save_path is not None:
        fig.savefig(Path(save_path), dpi=dpi, bbox_inches="tight")

    return fig, ax


tomo = TomographyBuilder(
    lens_survey="desi",
    lens_sample="lrg",
    source_survey="lsst",
    source_year="1",
    overlap_threshold=0.10,
    source_behind_lens=True,
    center_method="mean",
    lens_overrides={
        "bins": {
            "edges": [0.4, 0.6, 0.8, 1.0],
        },
    },
)

inputs = tomo.prepare_bins()

lens_result = inputs["lens_result"]
source_result = inputs["source_result"]
lens_centers = inputs["lens_bin_centers"]
source_centers = inputs["source_bin_centers"]
bin_pairs = inputs["bin_pairs"]

print("Selected lens-source bin pairs:")
for lens_bin, source_bin in bin_pairs:
    print(f"  lens {lens_bin + 1} - source {source_bin + 1}")

print("\nLens bin centers:")
for bin_index, center in lens_centers.items():
    print(f"  lens {bin_index + 1}: z = {center:.3f}")

print("\nSource bin centers:")
for bin_index, center in source_centers.items():
    print(f"  source {bin_index + 1}: z = {center:.3f}")

plot_lens_and_source_bins(
    lens_result,
    source_result,
    figsize=(8, 5),
)

plt.show()